By: Mike Fong and Laura Solis, Lower Valley Matters
260. That’s the total number of Granger residents who voted in the general election in November 2025. 19% of registered voters in Granger turned in their ballots compared to 27% overall in Yakima County, representing the 4th lowest city’s turnout in the state. With information provided by Fulcrum Strategy Group and Progressive Strategies NW, Lower Valley Matters dug deeper into Granger’s historical voting patterns and demographics to provide some insights about civic engagement and voter participation.
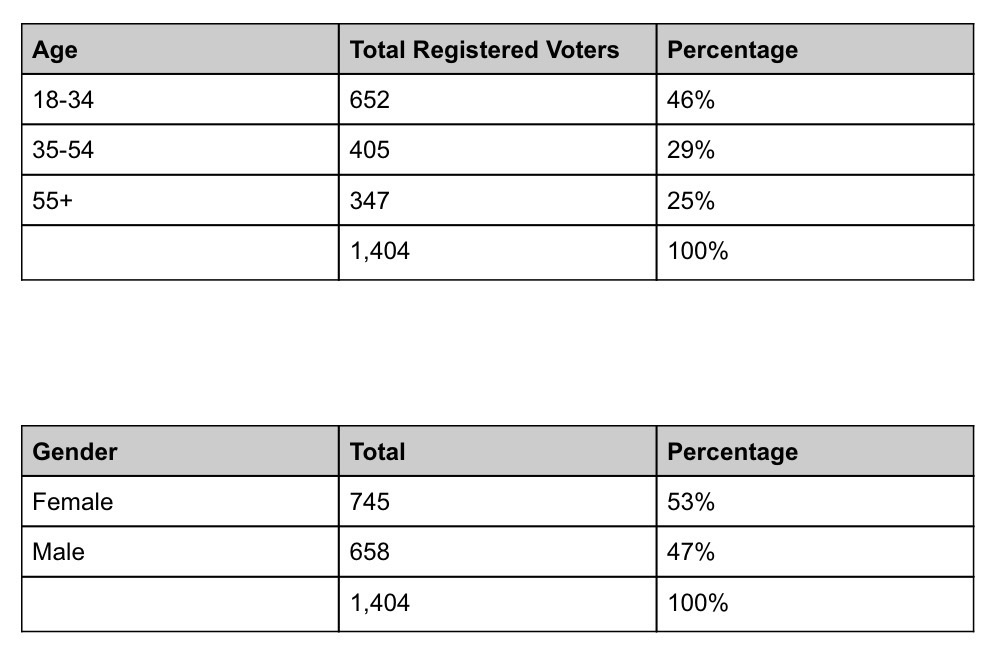
Who is voting? The largest percentage of the 1,404 registered voters in Granger—46%—are between 18-34 years old. This represents a much younger population of registered voters than Yakima County at large, where only 30% of registered voters are 34 and younger (by contrast, more than 40% of registered voters in Yakima County are 55+ and 30% are 35-54).
More women are registered to vote than men in Granger, which tracks almost exactly with Yakima County. Here’s how Granger’s registered voters break out by age and gender:
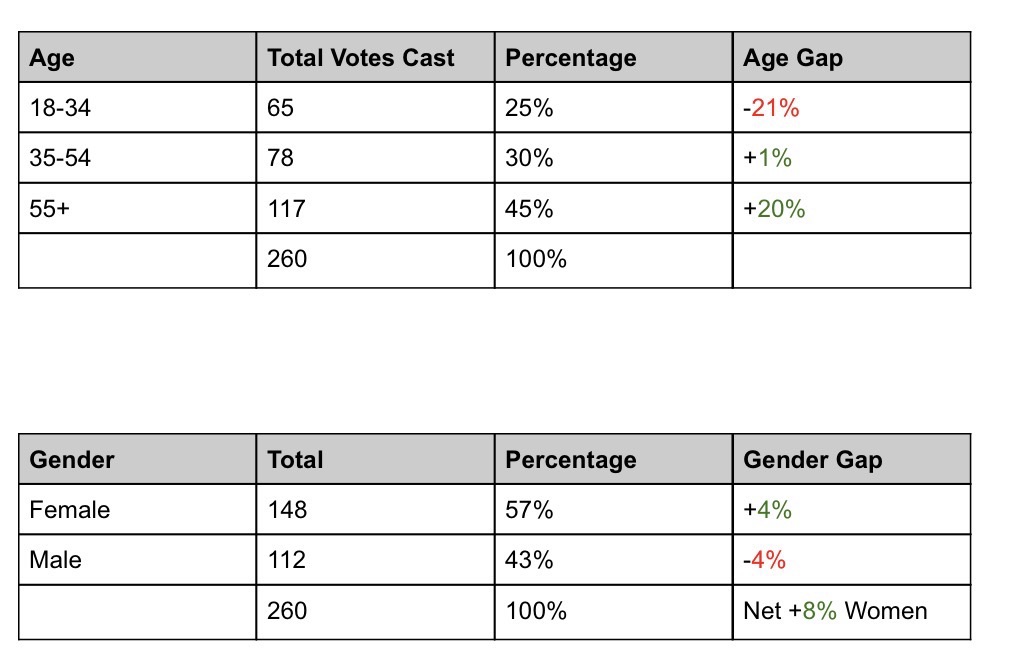
But when it comes to who is actually casting ballots, the data tells an entirely different story. In the November 2025 election, only 25% of the 260 Granger residents who voted were younger than 34. Meanwhile, residents 55+ voted at an overwhelmingly disproportionate rate compared to the percentage of overall voters. And women voted at far higher numbers than men.
This means that in large part, women, and in particular, those who are 55 and older play a significant factor in election outcomes in the city of Granger. And while younger voters tend to have lower turnout at the ballot in general, the anemic turnout of younger voters in Granger is even more dramatic: the 18-34 group represent almost 50% of all registered voters, but only 10% of them actually voted (65 out of 652).
The breakdown of voters by age and gender is as follows:
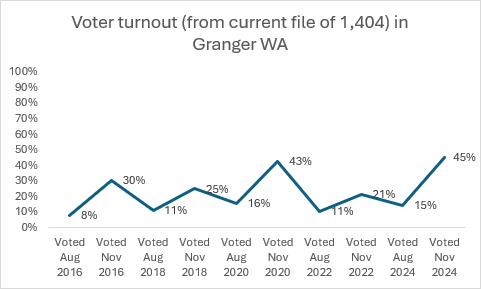
Historical Trends. If there’s one silver lining, it is that historical voting trends among all ages show that the trend line appears to be going up for presidential elections, and while it is still rather low compared to the rest of the state, there is a lot of room for growth. The chart below shows the past even-year election cycles (we focused on even-year cycles because they tend to have a higher voter turnout since these are contests for President and mid-term Congressional, statewide and local legislative seats). What we know is that in the elections of November 2020 and 2024, 70% of registered voters in Washington voted while only 43-45% voted in Granger.
Why it Matters. Awareness is half the battle, which is why we created Lower Valley Matters a month ago. Voting and amplifying people’s voices around government is the most basic civic and democratic expression we have, whether it is voting in elections or sharing thoughts about roundabouts. And just maybe this will help boost some of these low voter turnout numbers along the way!
If you found this article interesting, follow-us at https://www.facebook.com/profile.php?id=61593626991667
View more stories at lowervalleymatters.com

